Addtional Monitoring Codes
-
Hello!
I am trying to add wind data to our monitoring for while we're on passage (for others to see).
When I tried to add monitoring the drop down list did not include the items I'd like to monitor. I have downloaded a PDF of NMEA 2000 PGNs but that hasn't really helped.
I'd like to monitor the following:
TWS
AWS
TWD
AWD
AWA
TWA
STW
VMG
COG
CMG
MAX TWS
MAX AWS
AVG SOG
MAX SOG
MAX STW
AVG STWIf you can just point me in the right direction WRT the code/format and PGNs (or where to obtain them) I'm sure I can figure it out.
Thank you very much!
-
Hi Brian, we published a detailed tutorial for this: Saillogger NMEA 2000 Monitoring
In a nutshell:
Step 1: Find the Signal K path of the N2k data you want to monitor
Step 2: Add a custom monitoring section in Saillogger to monitor it. Ensure you choose the right type so Saillogger can do the necessary unit conversions for you (to degrees, knots, miles, meters/feet etc.)
-
Re-read your message, if this doesn't work, let's focus on one specific item first.
Make sure that field is available in N2k first, then make sure it shows up in the Data Browser for Signal K. If those happen but the path doesn't show up in Saillogger, restart Signal K and wait 10 minutes.
Please share your findings and we can try to help you more.
-
Thank you. The video tutorial was very helpful and I'm about half way there. Strangely COG, TWD and AWA are displayed as knots. The trip log is a crazy value so perhaps I should just kill that?
I'm not finding any averages (SOG, TWS, AWS, CMG) or maximum speeds (STW, SOG, TWS, AWS).
If this data is a function of our MFD and its caching (is that even a thing?!) then perhaps it's not possible. I'd imagine it would be possible for Saillogger to know Maximum values but perhaps not?
-
I was about to say that, more stateful things like average and maximum are not normally transmitted on NMEA, I don't believe they have PGNs either. Saillogger definitely calculates the averages and max and gives it as part of a trip/log summary but from what I understand you want to display that during the trip itself? If so, while doable, they are not currently calculated during a trip.
-
Strangely COG, TWD and AWA are displayed as knots.
You should use the same unit per monitoring block and choose the monitoring type accordingly. So instead of a single "Sailing Performance Data", you could have multiple blocks. All values in a single block will share the same unit.
-
I was about to say that, more stateful things like average and maximum are not normally transmitted on NMEA, I don't believe they have PGNs either. Saillogger definitely calculates the averages and max and gives it as part of a trip/log summary but from what I understand you want to display that during the trip itself? If so, while doable, they are not currently calculated during a trip.
@admin Understood and thank you.
Ideally, I'd like to capture maximums for each trip but this isn't critical. Currently I write them down manually in our log book. It would be neat to capture that for each individual trip but, again, it's not critical. Just nice to have.
-
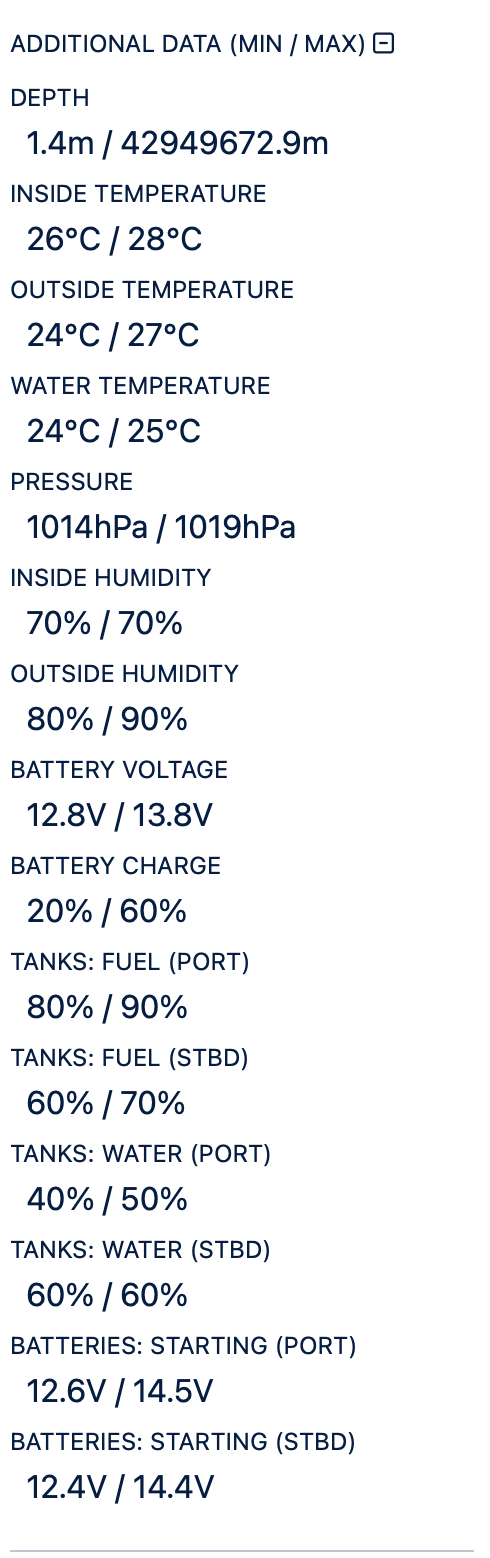
Curious if there is a confusion. In regards to wind average/max and SOG average/max, they are already part of each trip log. Here is an example:
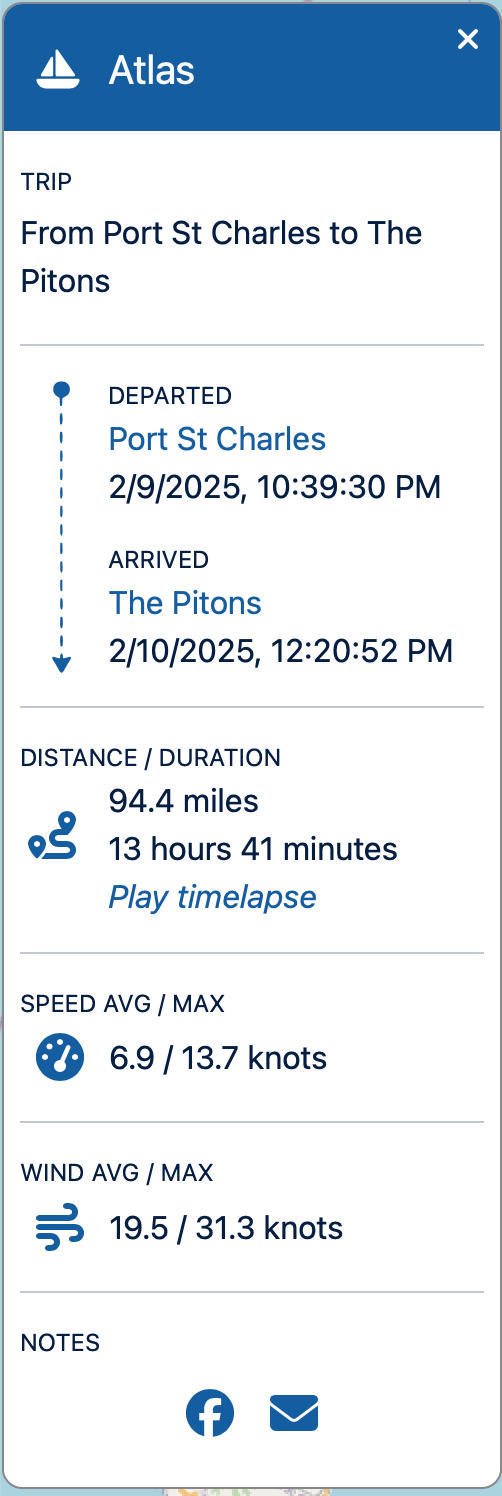
Bottom two sections have those.
When you add additional monitoring data, minimum and maximum of those values will also be captured and displayed per log (under a section called Additional Data). Average is a bit more contextual and only makes sense for few types, so these are minimum and maximum right now.
Hello! It looks like you're interested in this conversation, but you don't have an account yet.
Getting fed up of having to scroll through the same posts each visit? When you register for an account, you'll always come back to exactly where you were before, and choose to be notified of new replies (either via email, or push notification). You'll also be able to save bookmarks and upvote posts to show your appreciation to other community members.
With your input, this post could be even better 💗
Register Login