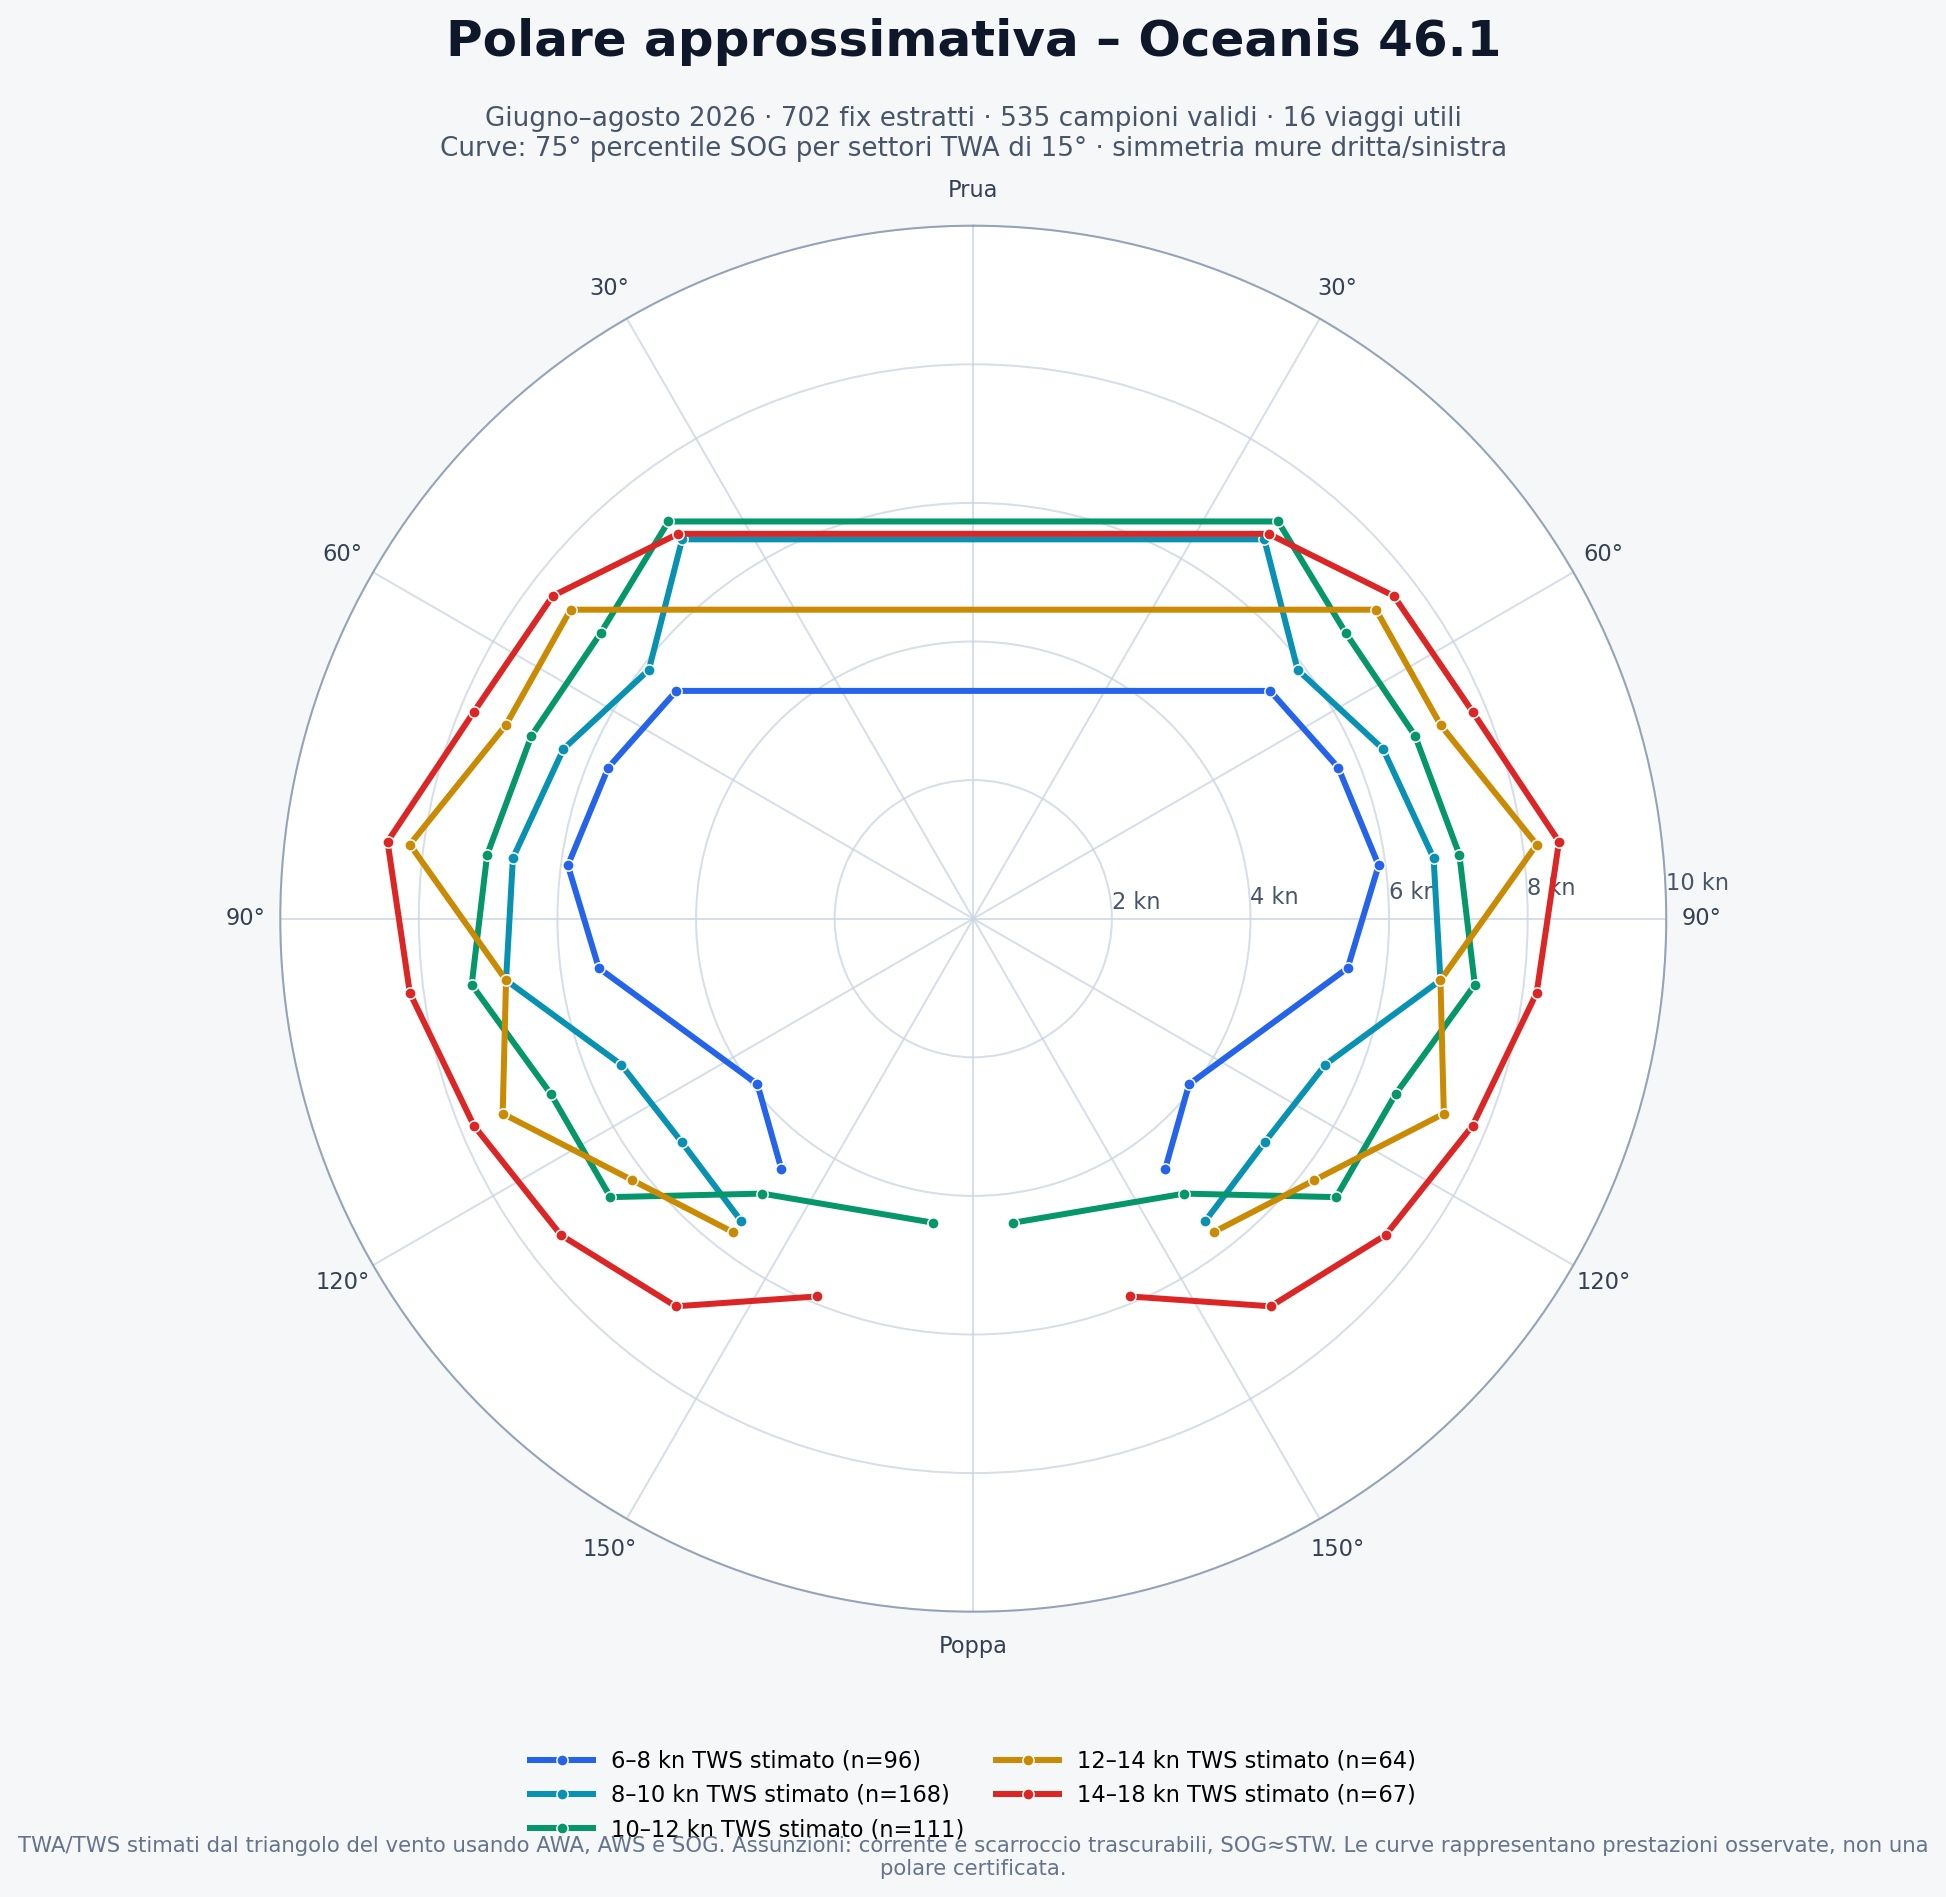
Only analysing my navigations between June and the end of August and despite not having TWS TWA and STW among the data and using the wind triangle the polar is plausible
A
Andrea
@Andrea
Posts
-
track information -
track information -
track informationWe are at the beginning of a new trial, but the results are encouraging. My instruments include TWA and TWS, but not STW—though I can add it. How do I ensure these parameters are also recorded in the fix-by-fix track? Thanks for the help.
-
track informationHi,
I successfully used get_trip_samples to retrieve the data from both trips recorded on September 20 and combined them into a CSV containing 68 fixes.
As a first test, I used these data to generate the attached observational polar diagram for my Beneteau Oceanis 46.1.
For the diagram, I:
excluded all fixes where the engine was running;
excluded fixes with zero speed or missing wind data;
retained 38 valid sailing samples;
used apparent wind angle (AWA) as the angular coordinate;
used speed over ground (SOG) as the radial coordinate;
represented apparent wind speed (AWS) through the colour scale;
added red diamonds showing the median SOG within 15-degree AWA sectors containing at least two observations.
The result is a useful proof of concept, but it is not yet a conventional performance polar. The available samples contain AWA, AWS and SOG, whereas a more accurate sailing polar would ideally use true wind angle (TWA), true wind speed (TWS) and speed through water (STW).
The dataset is also still quite limited and unevenly distributed. Most of the valid observations are concentrated between approximately 30° and 60° AWA, with very few samples from reaching and downwind conditions. For this reason, I kept the individual measured points visible instead of interpolating continuous curves through areas where no observations exist.
My next objective is to use list_sailing_samples across a much longer period and create separate performance curves for different wind-speed ranges.
Could you please confirm whether TWA, TWS and STW, when reported by the boat, can be requested as extra readings through get_trip_samples and list_sailing_samples? If they are not currently stored for each fix, would it be technically possible to add them in the future?
The new sample-level tools are exactly what I needed for this project, and this first result already looks very promising.
Best regards,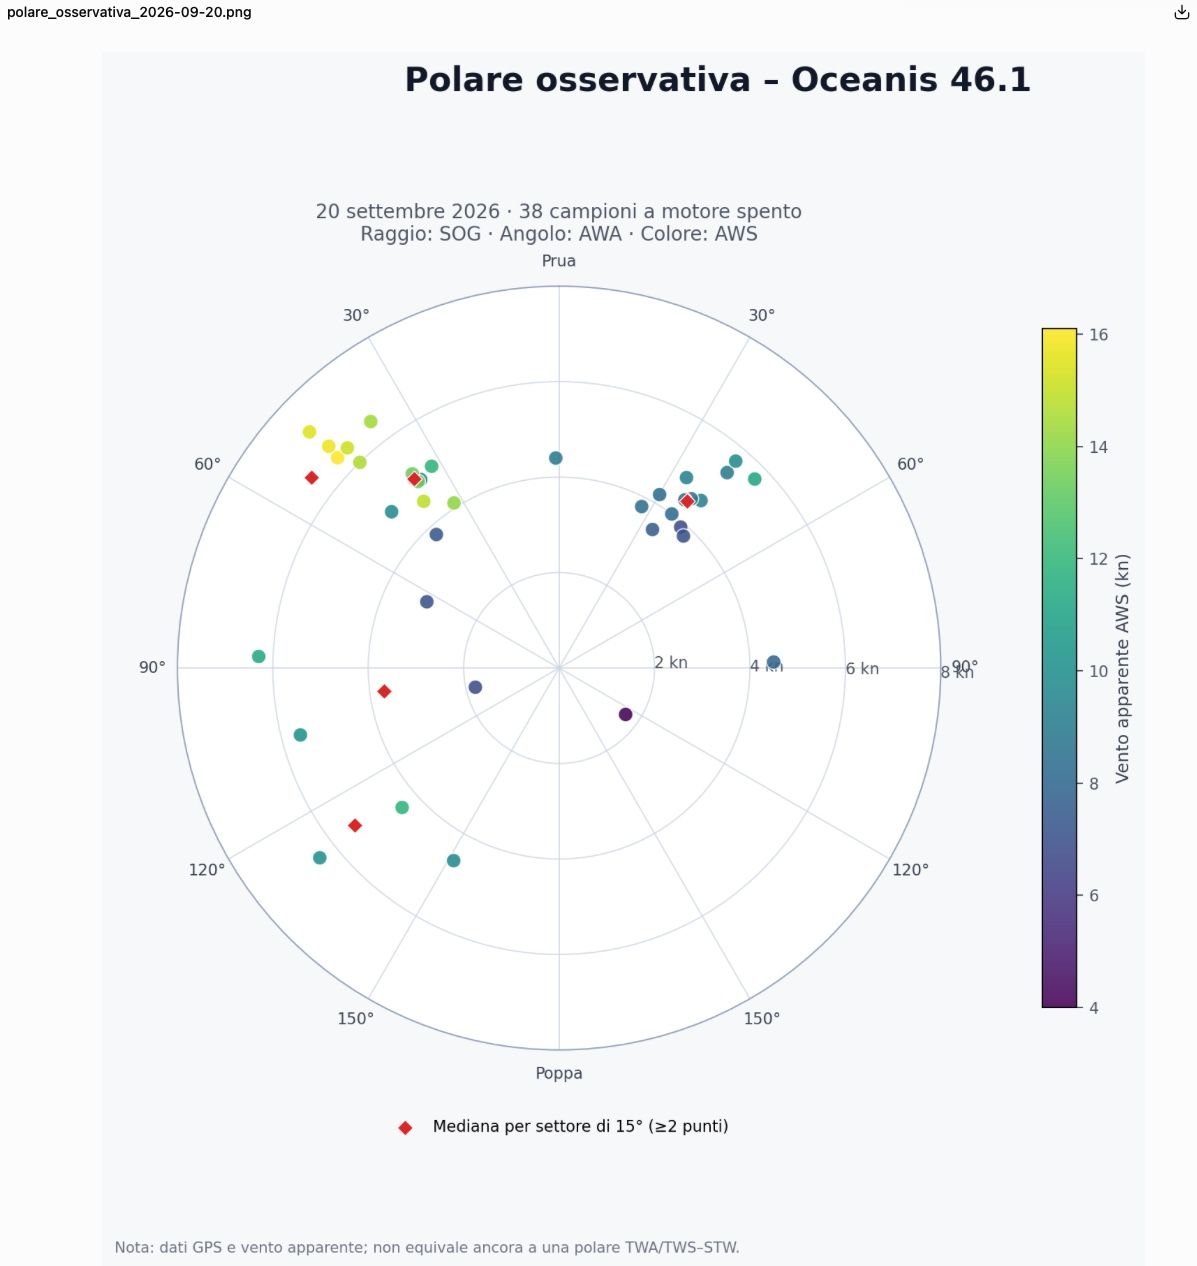
-
track informationObviously I disconnected and reconnected the mcp server and used a new chat twice
-
track informationI tested the Saillogger connector again and specifically asked ChatGPT to use get_trip_samples for the trips on September 20.
ChatGPT can correctly see the two trips from that day:
- Trip 52048 — Marina Cala de Medici → Faro delle Secche di Vada, 8.5 NM
- Trip 52059 — Faro delle Secche di Vada → Marina Cala de Medici, 7.3 NM
However, get_trip_samples is still not exposed in the toolset available to ChatGPT.
The available tools still include functions such as list_trips, get_trip, get_sensor_history, etc., but not get_trip_samples.
So it looks like ChatGPT is still receiving the older Saillogger tool definition, even though the connector itself is connected and working.
This seems consistent with your suggestion that the toolset may still be stale after the September 20 update.
If useful, the exact trip IDs are now known: 52048 and 52059.
-
track informationThe one above is the AI's response to my request, we are not far away, what do you think?
-
track informationI tested the updated connector using Philomene’s trip on September 20. I can now access the GPS track and trip summary data, including average/max SOG, AWA range, AWS average/max, sailing vs motoring time, and the route points.
However, I still cannot access synchronized point-by-point samples linking boat speed and wind data along the track. To build even a rough empirical polar, I would need data in this form:
timestamp, latitude, longitude, SOG, AWA, AWS
and ideally, if available:
COG, heading, STW, TWA, TWS, RPM
At the moment, the connector appears to provide GPS track + aggregated trip statistics, but not the wind/speed values associated with each individual track point. If a “trip track points” endpoint could expose those synchronized samples, I could generate a useful empirical polar directly from Saillogger data.
-
track informationWhen do you think it will be possible to export a table of the data we talked about and that Saillogger has recorded? Otherwise the AI can't analyse them?
-
track informationAs soon as you announced the AI integration, I immediately made the connection: I thought that if the AI could read a table of data for each leg—containing metrics like AWS, AWA, and STW—it could easily generate a polar diagram for me. What do you think?
-
track informationIn my previous tracks, every time I touched the track, apparent wind speed, apparent wind direction, boat speed and compass bow appeared. Is it possible to enrich that graph and maybe extract a table? Thank you
-
track informationHello, the new layout on both iOS and the web client is excellent and comprehensive; however, I can no longer see data such as wind speed, wind direction, boat speed, etc., for the recorded trip tracks. I wanted to analyze this data to try and create polar diagrams, but I can't see it anymore. Is there a way to view it again?
-
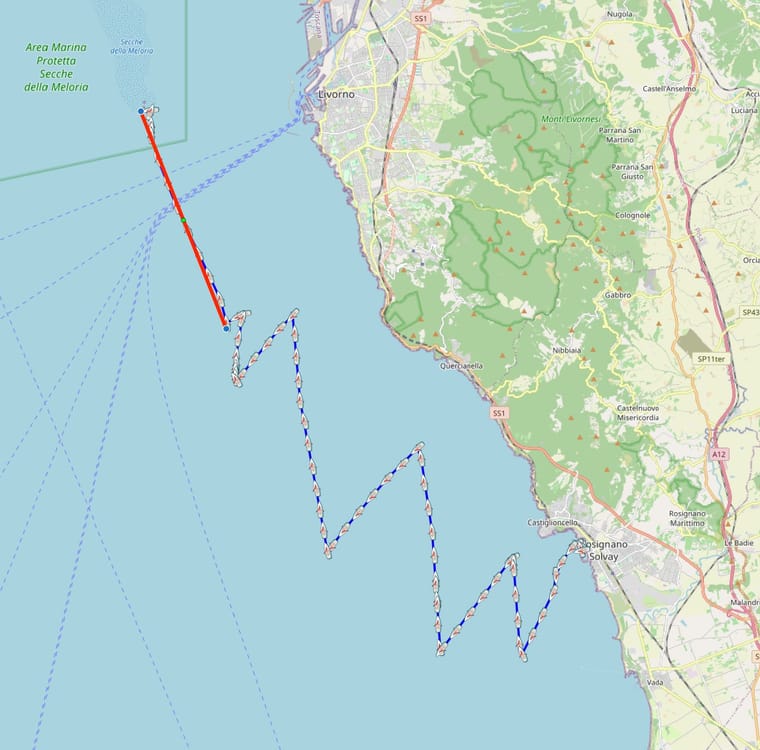
sailing and motor trackLike many sailors, I'm very careful to use the engine as little as possible, even when the wind is light (like in the Mediterranean Sea) or coming from the wrong direction compared to my destination. This is why I was one of the users who asked to be able to see the percentage of the route sailed versus the portion under power in the trip reports. I'd like to ask the developers, if possible, to color the portion of the route sailed differently from the portion under power, so I can immediately get a sense of the results. Would this be possible?
-
Boat Offline@admin Now that explains everything. Thanks.
-
Boat OfflineHi Admin, thanks for the reply. Something strange happened in my experience. When I took the boat to the shipyard for dry docking, I turned off the instruments (N2K). Since the Saillogger plugin runs on SK server on VenusOs on CerboGX, and that remained active and powered, I expected the data relating to the service and starter batteries to arrive on Saillogger. Instead, everything froze. I tried restarting SK server several times and checked that the Saillogger plugin was working properly on the iOS application, or that the Saillogger web app was not updating the battery voltage data.
Once the boat was picked up from the shipyard and the instruments were turned on, everything worked again. -
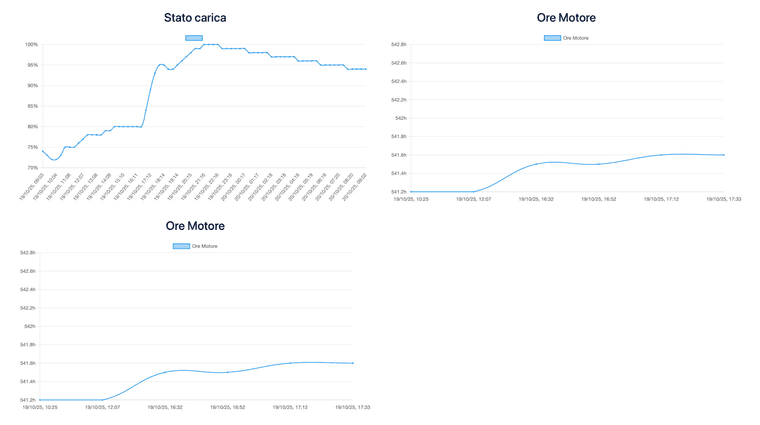
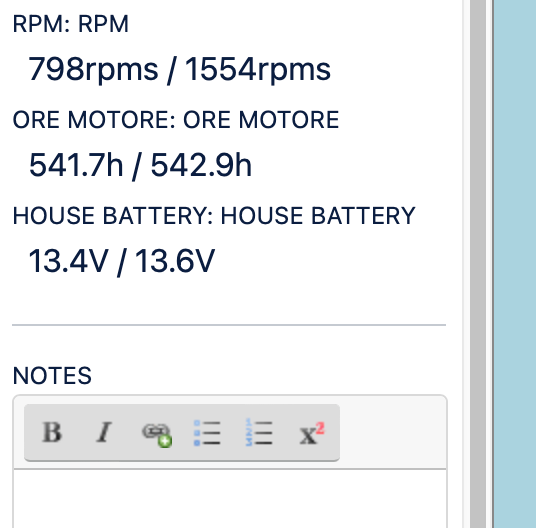
record engine hours on trip logs@admin I configured another "engine hours" data item, taking the same variable from SK, namely "Propulsion.Port.runTime." In fact, I now have two in my configuration. Both now work; even the one that wasn't previously recording data on the graph now records values over time. I can say that the problem is solved. Thanks.