
track information
-
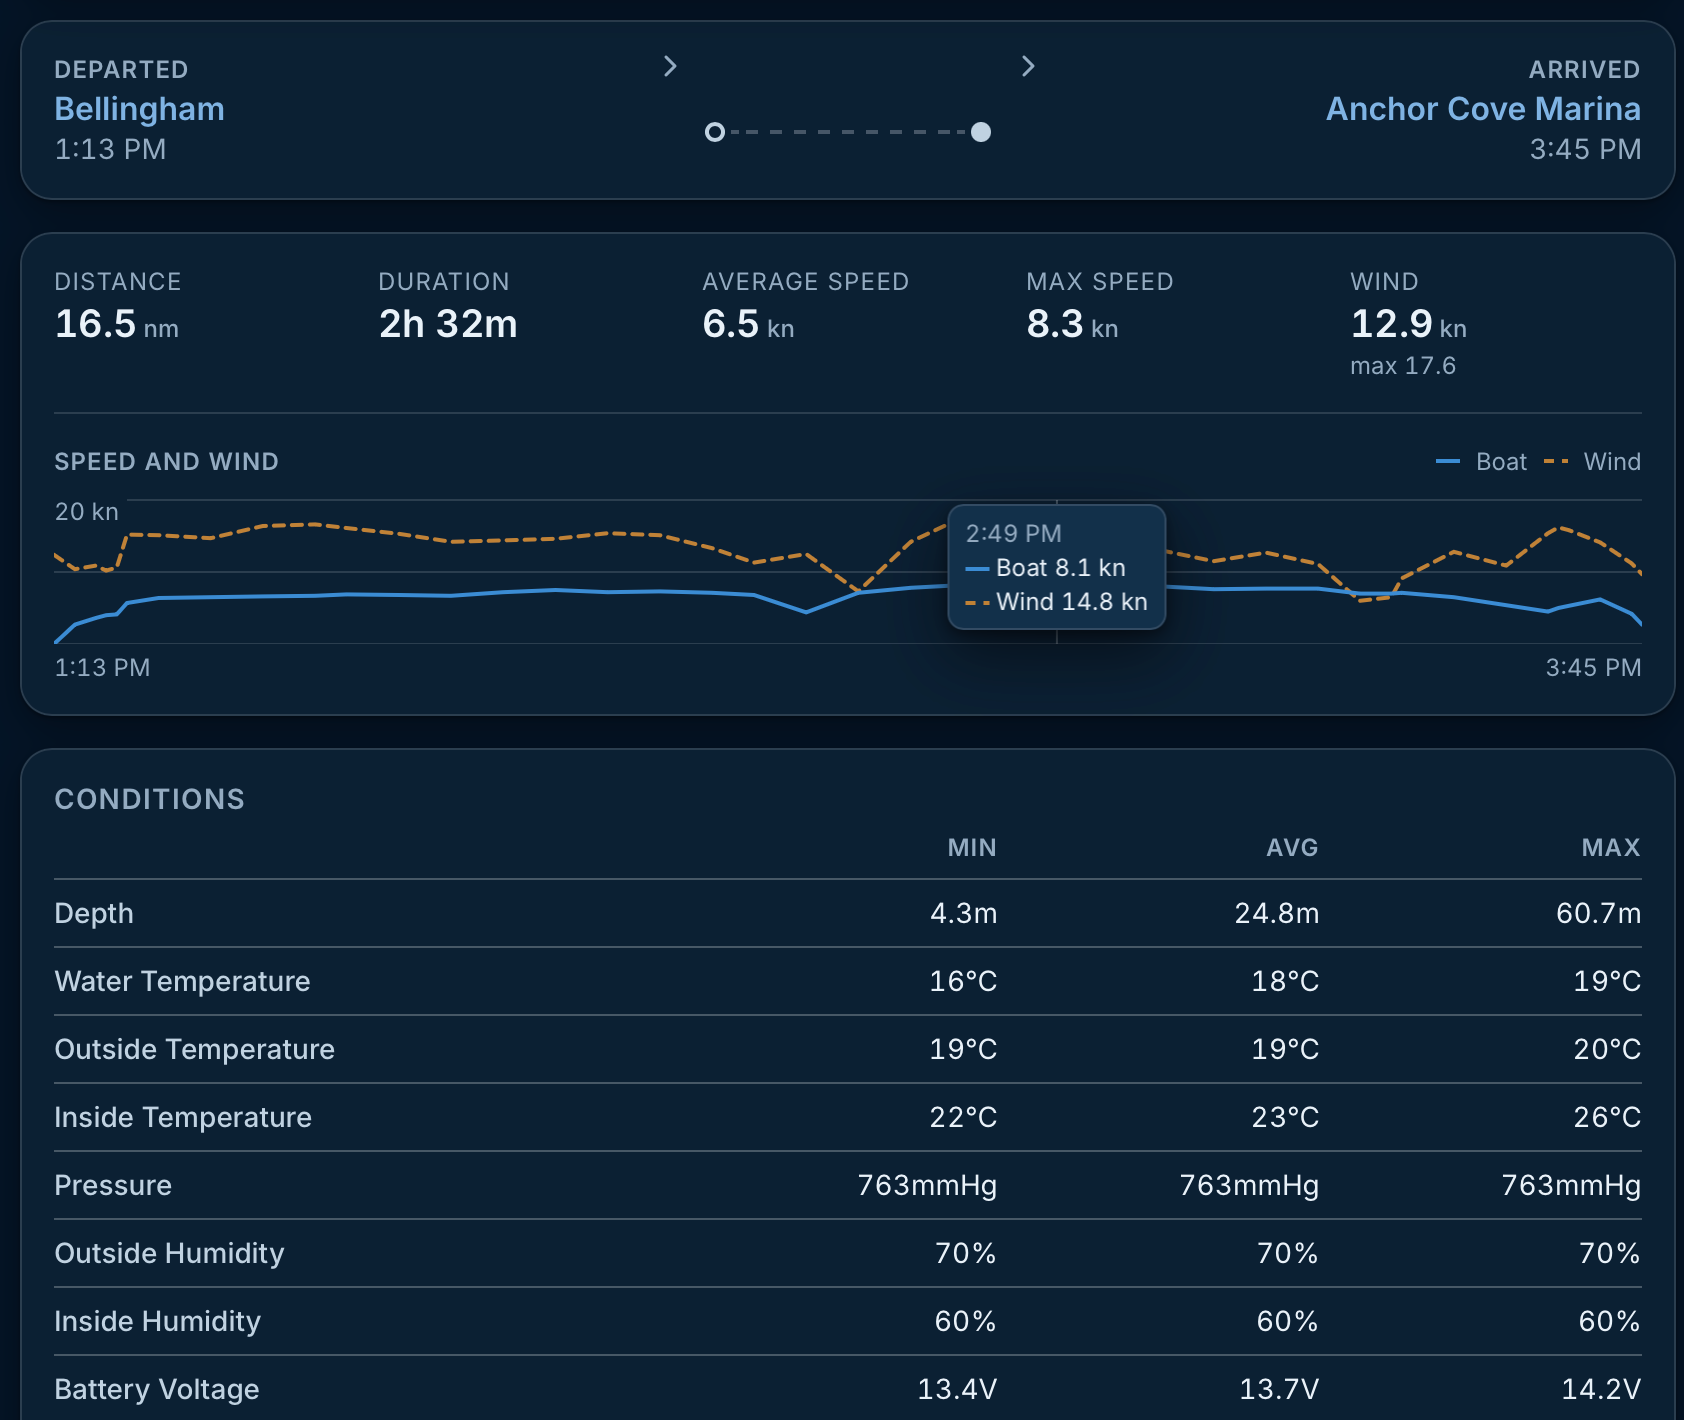
Hello, the new layout on both iOS and the web client is excellent and comprehensive; however, I can no longer see data such as wind speed, wind direction, boat speed, etc., for the recorded trip tracks. I wanted to analyze this data to try and create polar diagrams, but I can't see it anymore. Is there a way to view it again?
-
In my previous tracks, every time I touched the track, apparent wind speed, apparent wind direction, boat speed and compass bow appeared. Is it possible to enrich that graph and maybe extract a table? Thank you
-
In my previous tracks, every time I touched the track, apparent wind speed, apparent wind direction, boat speed and compass bow appeared.
Ah yes, the clicks on the route is on the to-do list
As soon as you announced the AI integration, I immediately made the connection: I thought that if the AI could read a table of data for each leg—containing metrics like AWS, AWA, and STW—it could easily generate a polar diagram for me. What do you think?
This is a good idea, and it’s live now. A connected assistant can read every position fix of a trip, or of a whole season, with speed and course over ground, apparent wind speed and angle, and whether the engine was running. So you can ask it for a polar diagram, or for your boat speed in a given wind band, and it has the numbers to work from.
Two things to know about the data. Speed through water isn’t recorded by default, so any true-wind or polar calculation is ground-referenced (current included); if your setup sends STW as a custom monitoring value, the assistant can read that too. And each fix carries the highest speed and wind speed of the minute before it, so the result will read a little optimistic. A rough polar, but a real one, from your own logbook!
If you try it, I’d like to hear how it goes.
-
It is actually there since this morning! Tell your AI agent to use Saillogger MCP at https://saillogger.com/mcp and it should have everything ready to go.
-
I tested the updated connector using Philomene’s trip on September 20. I can now access the GPS track and trip summary data, including average/max SOG, AWA range, AWS average/max, sailing vs motoring time, and the route points.
However, I still cannot access synchronized point-by-point samples linking boat speed and wind data along the track. To build even a rough empirical polar, I would need data in this form:
timestamp, latitude, longitude, SOG, AWA, AWS
and ideally, if available:
COG, heading, STW, TWA, TWS, RPM
At the moment, the connector appears to provide GPS track + aggregated trip statistics, but not the wind/speed values associated with each individual track point. If a “trip track points” endpoint could expose those synchronized samples, I could generate a useful empirical polar directly from Saillogger data.
-
This appears to be a stale toolset issue. The connector was updated on September 20 with two new reads: “Trip readings, fix by fix” (get_trip_samples), every fix of one trip, and “Sailing readings across trips” (list_sailing_samples), the engine-off fixes across a period, for exactly this kind of work. Each row carries time, latitude, longitude, SOG, COG, apparent wind speed and angle, and whether an engine was running. Engine RPM and any other reading the boat reports (depth, pressure, your own sensors) can be requested by name.
Your assistant’s summary matches the older tool set, so its list of tools is probably from before the update. Disconnecting and reconnecting the Saillogger connector, then starting a new chat, refreshes it. You can also ask directly: “Use get_trip_samples for the trip on September 20 and give me the rows as CSV.”
-
I tested the Saillogger connector again and specifically asked ChatGPT to use get_trip_samples for the trips on September 20.
ChatGPT can correctly see the two trips from that day:
- Trip 52048 — Marina Cala de Medici → Faro delle Secche di Vada, 8.5 NM
- Trip 52059 — Faro delle Secche di Vada → Marina Cala de Medici, 7.3 NM
However, get_trip_samples is still not exposed in the toolset available to ChatGPT.
The available tools still include functions such as list_trips, get_trip, get_sensor_history, etc., but not get_trip_samples.
So it looks like ChatGPT is still receiving the older Saillogger tool definition, even though the connector itself is connected and working.
This seems consistent with your suggestion that the toolset may still be stale after the September 20 update.
If useful, the exact trip IDs are now known: 52048 and 52059.
-
Thank you for the specific report, it found a real problem. ChatGPT keeps the list of tools from when the Saillogger app was added, and it caps the size of that list; the two new reads pushed ours just over the cap, so ChatGPT kept your old list even after you reconnected. This a ChatGPT specific limitation, other agents don't exhibit that but there were options on our end so that is fixed on our side now.
To pick up the new tools, open ChatGPT’s Settings > Apps > Saillogger and press Refresh, then start a new conversation. Reconnecting alone does not update the list. You should then see “Trip readings, fix by fix” (get_trip_samples) and “Sailing readings across trips” (list_sailing_samples). For trips 52048 and 52059, each row carries time, latitude, longitude, SOG, COG, apparent wind speed and angle and whether an engine was running; engine RPM comes along if you ask for it by name.
-
Hi,
I successfully used get_trip_samples to retrieve the data from both trips recorded on September 20 and combined them into a CSV containing 68 fixes.
As a first test, I used these data to generate the attached observational polar diagram for my Beneteau Oceanis 46.1.
For the diagram, I:
excluded all fixes where the engine was running;
excluded fixes with zero speed or missing wind data;
retained 38 valid sailing samples;
used apparent wind angle (AWA) as the angular coordinate;
used speed over ground (SOG) as the radial coordinate;
represented apparent wind speed (AWS) through the colour scale;
added red diamonds showing the median SOG within 15-degree AWA sectors containing at least two observations.
The result is a useful proof of concept, but it is not yet a conventional performance polar. The available samples contain AWA, AWS and SOG, whereas a more accurate sailing polar would ideally use true wind angle (TWA), true wind speed (TWS) and speed through water (STW).
The dataset is also still quite limited and unevenly distributed. Most of the valid observations are concentrated between approximately 30° and 60° AWA, with very few samples from reaching and downwind conditions. For this reason, I kept the individual measured points visible instead of interpolating continuous curves through areas where no observations exist.
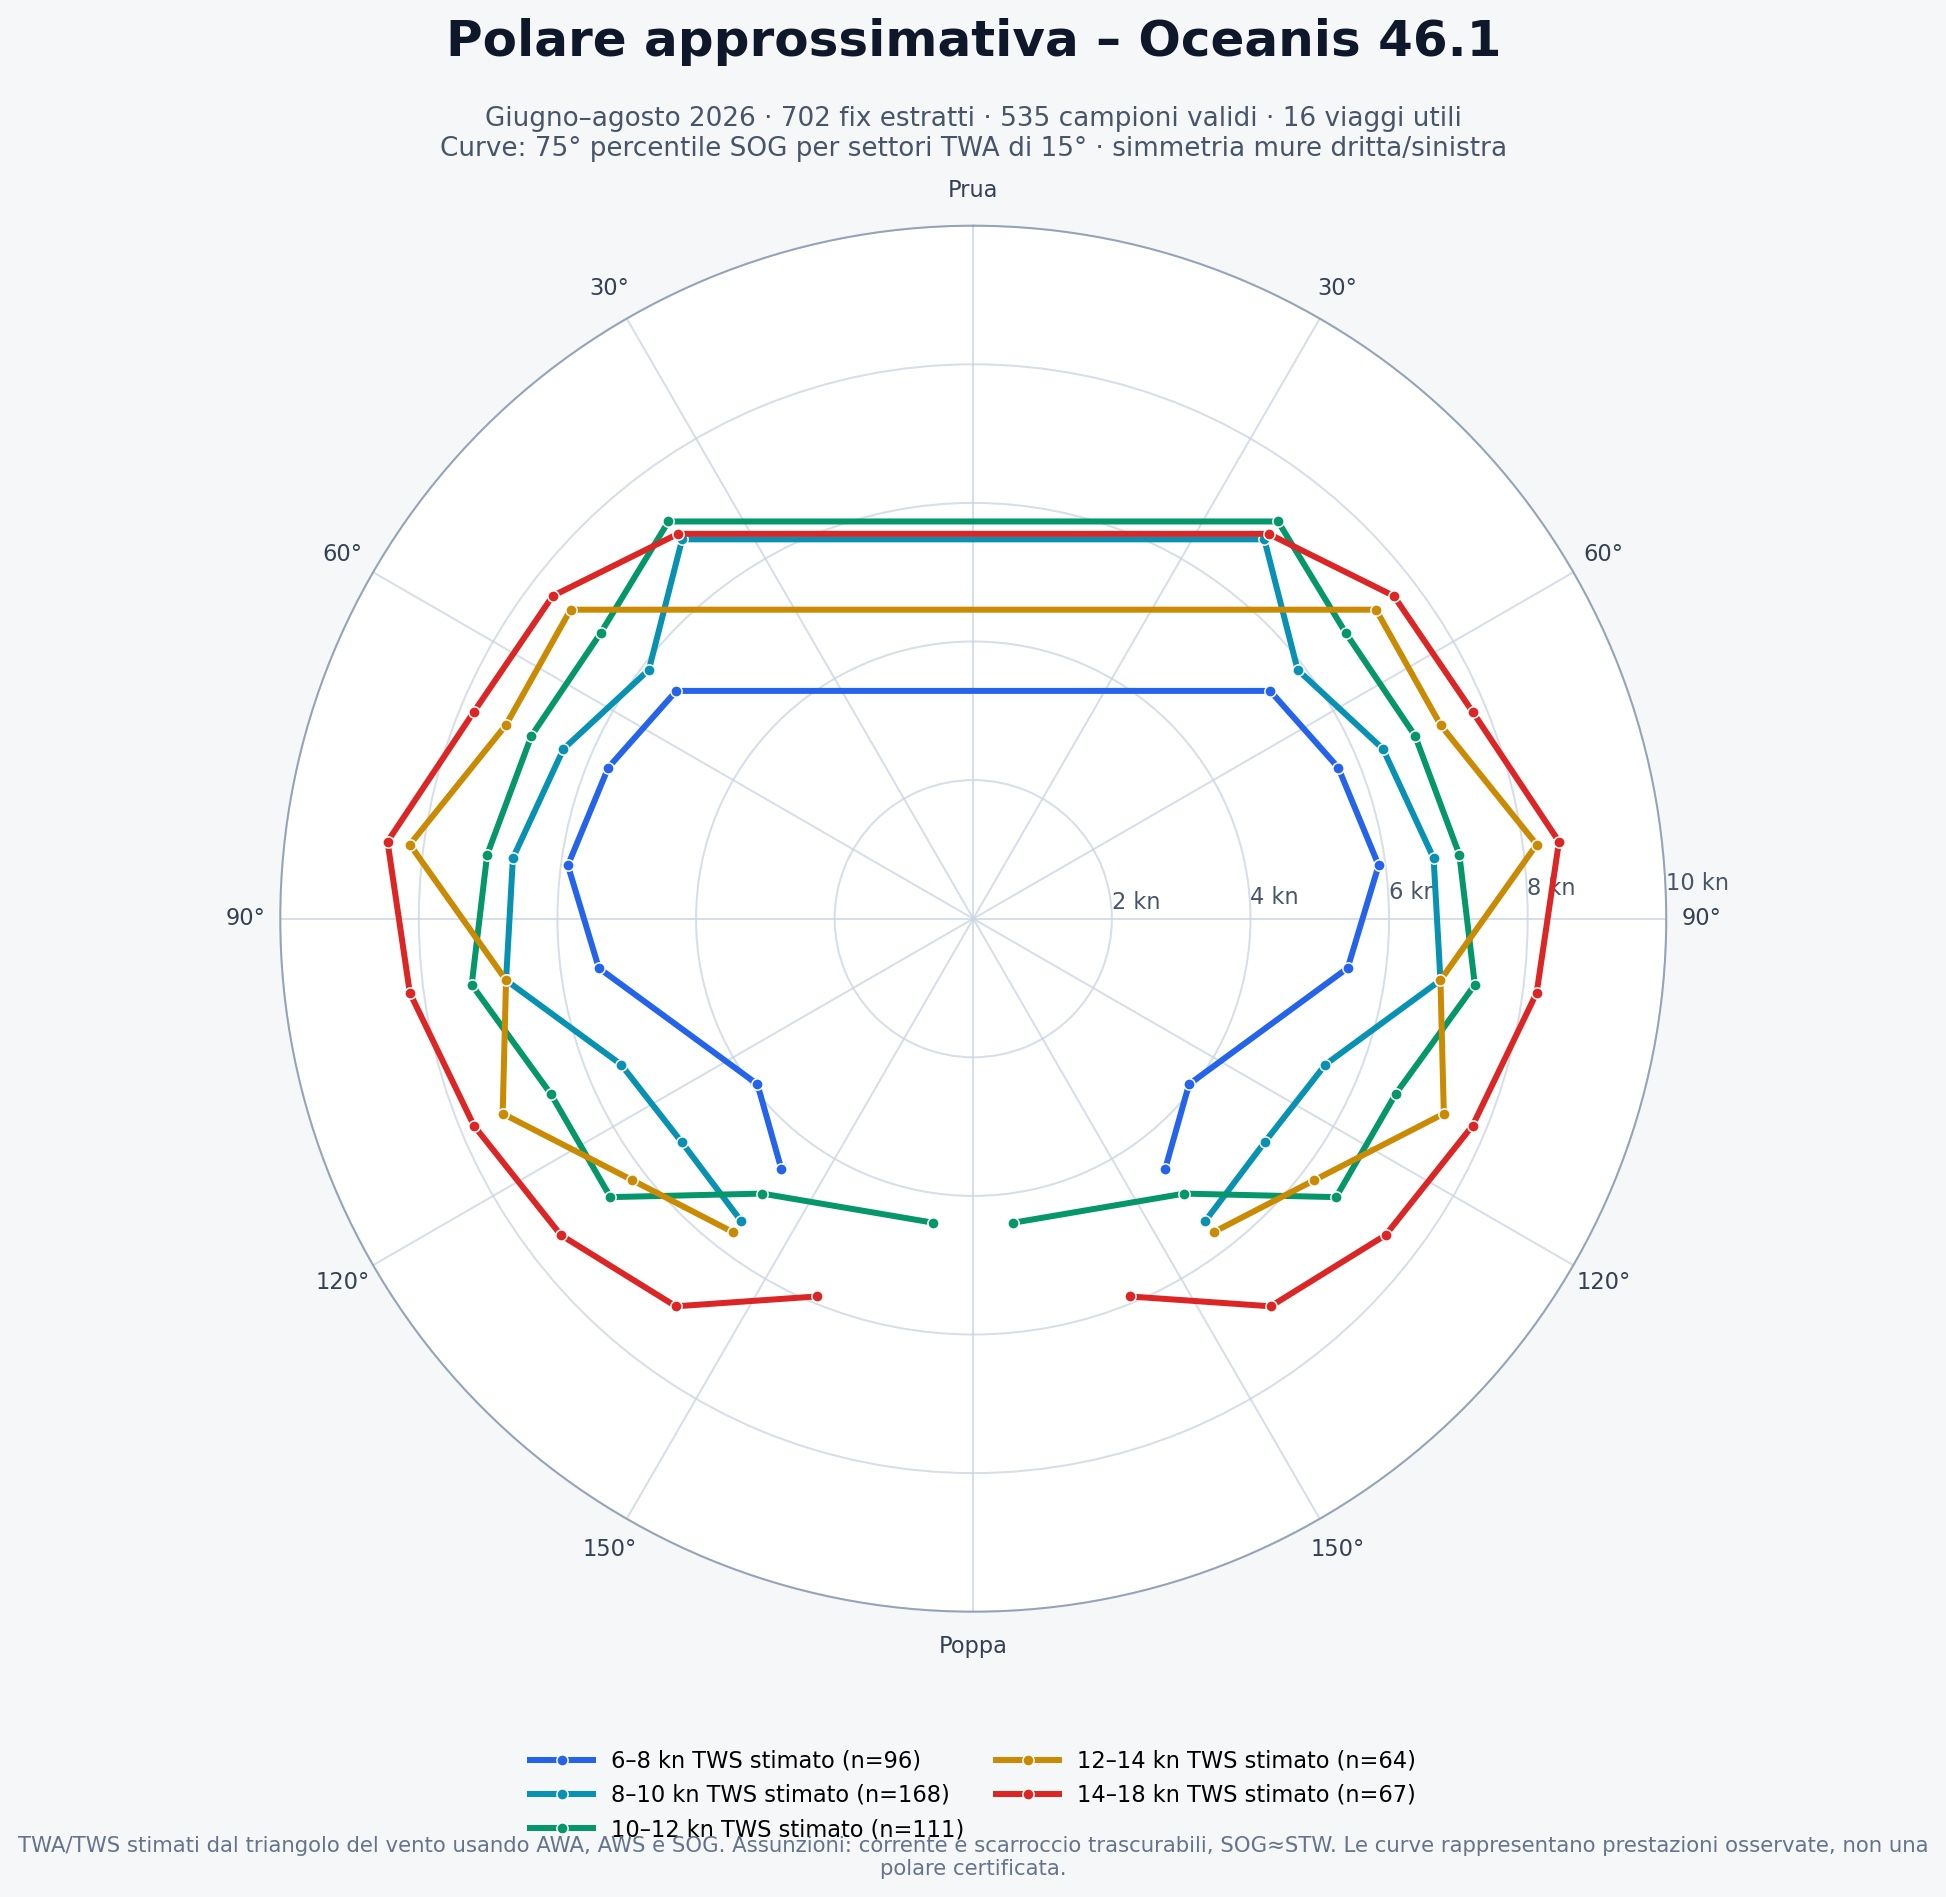
My next objective is to use list_sailing_samples across a much longer period and create separate performance curves for different wind-speed ranges.
Could you please confirm whether TWA, TWS and STW, when reported by the boat, can be requested as extra readings through get_trip_samples and list_sailing_samples? If they are not currently stored for each fix, would it be technically possible to add them in the future?
The new sample-level tools are exactly what I needed for this project, and this first result already looks very promising.
Best regards,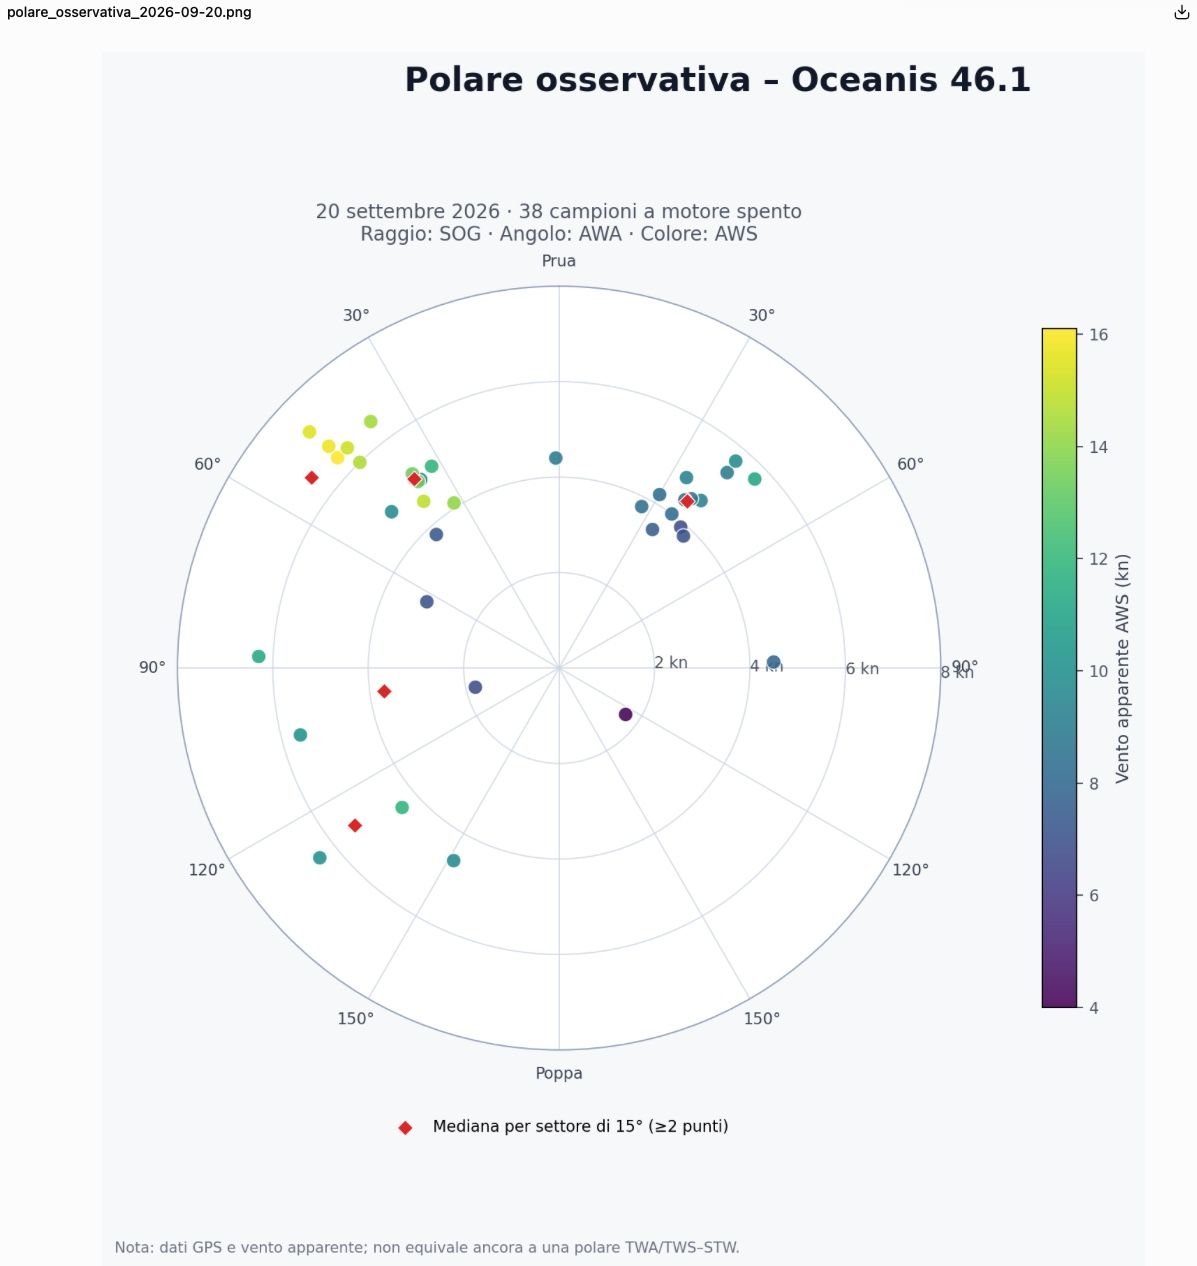

Hello! It looks like you're interested in this conversation, but you don't have an account yet.
Getting fed up of having to scroll through the same posts each visit? When you register for an account, you'll always come back to exactly where you were before, and choose to be notified of new replies (either via email, or push notification). You'll also be able to save bookmarks and upvote posts to show your appreciation to other community members.
With your input, this post could be even better 💗
Register Login